How to Set Up the eTapestry Home Dashboard
As marketers, fundraisers, and managers, we need information that offers immediate insight into fundraising performance, progress, and goal achievement. Generate this information on the home dashboard of your Blackbaud® eTapestry® database! The eTapestry home dashboard provides easy to read and actionable information on fundraising performance.
eTapestry Home Dashboard
The first page you see after the eTapestry login page is the home screen. The home screen is a layout of dashboard tiles that displays information on fundraising performance, navigation shortcuts, and help resources. Each user’s dashboard is unique to that user’s login, so you can setup your dashboard however you want.
Benefits of the eTapestry home dashboard:
- Generate information and analytics without queries and reports
- Benchmark performance against your organization’s goals
- Customize your dashboard differently than other users
- Print the home screen as a quick benchmark report (print icon in upper right)
Even though eTapestry dashboards offer these benefits, I commonly find that home dashboards are underutilized or neglected completely by eTapestry users.
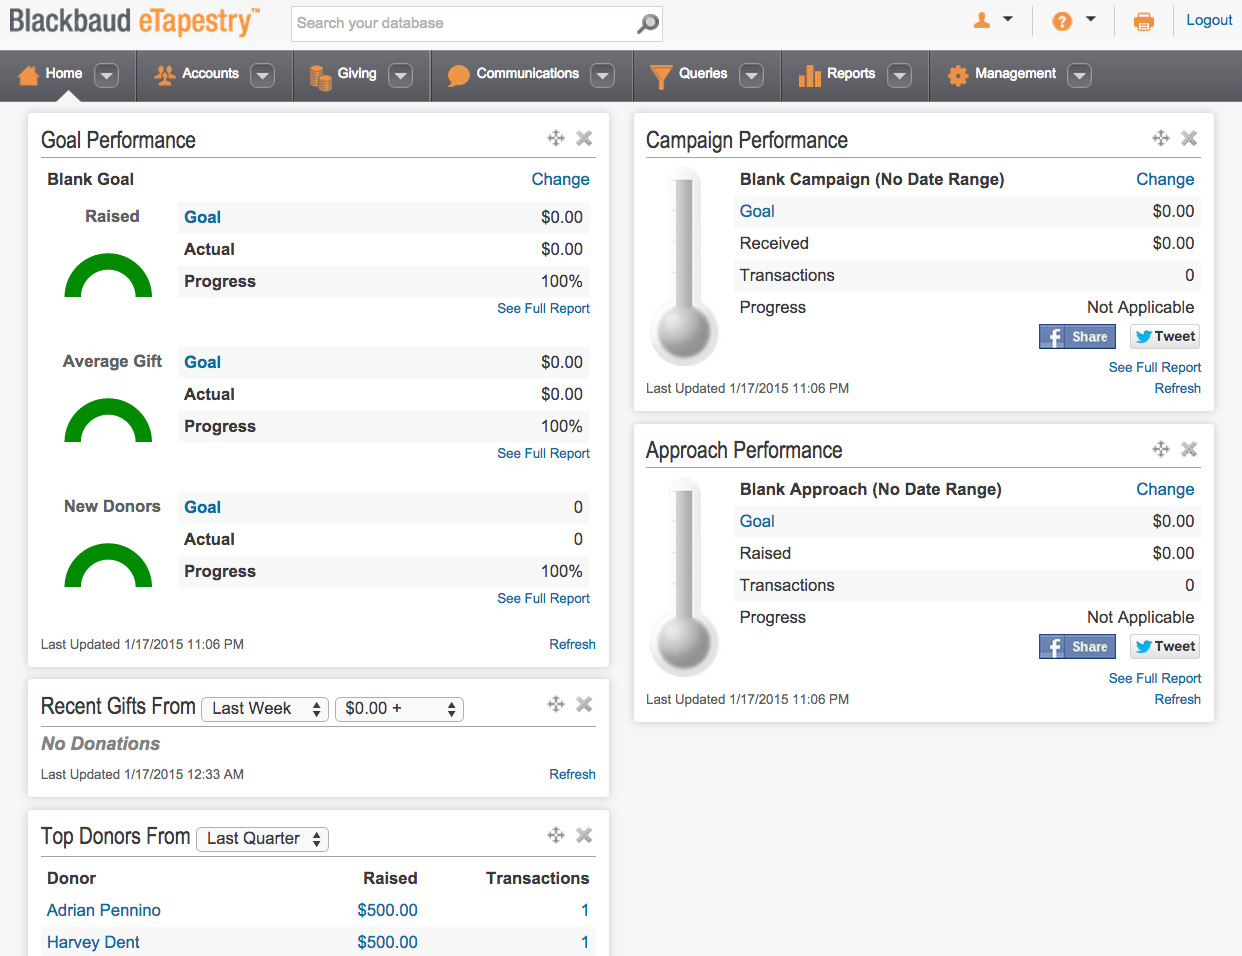
Most eTapestry home dashboards look like this.

In this example, the dashboard tiles show no relevant or actionable data. All of the tiles are grayed out or inactive because the systems that drive the home dashboard aren’t setup properly. However, the setup for the dashboard is very straightforward and is a primary way to “get more” from your eTapestry database. If your home dashboard looks like this, read on to learn how to setup your eTapestry dashboard.
eTapestry Dashboard Options
Various eTapestry dashboard tiles can be added and arranged on the home screen, but that doesn’t mean all of the standard tiles are helpful or valuable. You can review the list of available tiles by clicking the “Select Tiles and Layout” button at the bottom right of the home screen, but the following list of tiles are those that are generally most relevant, actionable, and valuable.
- Recently Viewed Accounts – Shows all accounts that you’ve recently accessed. This is a great shortcut that bypasses the search function for recently viewed accounts.
- Recently Viewed Queries and Reports – Shows all queries and reports that you’ve recently accessed. This is a great shortcut that bypasses searching for queries and reports in the query and report lists.
- Favorites – Shows all queries, reports, and communications templates that are flagged as favorites. This is a great shortcut for recurring queries, reports, and communications that are run on a consistent basis.
- Goal Performance – Shows real-time progress in a set date range toward benchmarks for total revenue, average gift size, and number of new donors.
- Campaign Performance – Shows real-time progress toward a benchmark for active campaigns in your eTapestry database.
- Approach Performance – Shows real-time progress toward a benchmark for active approaches in your eTapestry database.
- Top Donors – Shows top donors in your eTapestry database based on a user-defined selected date range.
- Recent Gifts – Shows recent donors in your eTapestry database based on a user-defined selected date range.
eTapestry Performance Dashboard Tiles
There are back-end features for the three “performance” dashboard tiles that need to be setup in order to work properly. Each of these tiles displays real-time performance compared to a benchmark goal, so it is important to set the benchmarks. Once the benchmarks are set in the system, your data is applied to those benchmarks and your dashboard will come to life. Setup your organization’s fundraising benchmarks with the steps below.
Goal Performance
- Select the Management drop-down
- Select Goals
- Select New Goal
- Name your goal
- Add a date range
- Add a revenue goal
- Add an average gift goal
- Add a new donors goal
- Select Save And
- The new Goal will now be available on your dashboard
Campaign Performance
- Select the Management drop-down
- Select Campaigns
- Select an existing Campaign or create a new one
- Enter a Goal as a dollar amount
- Enter a quantity as a count of transactions
- Select Save And
- The Campaign goal will now be available on your dashboard
Approach Performance
- Select the Management drop-down
- Select Approaches
- Select an existing Approach or create a new one
- Enter a Goal as a dollar amount
- Enter a quantity as a count of transactions
- Select Save And
- The Approach goal will now be available on your dashboard
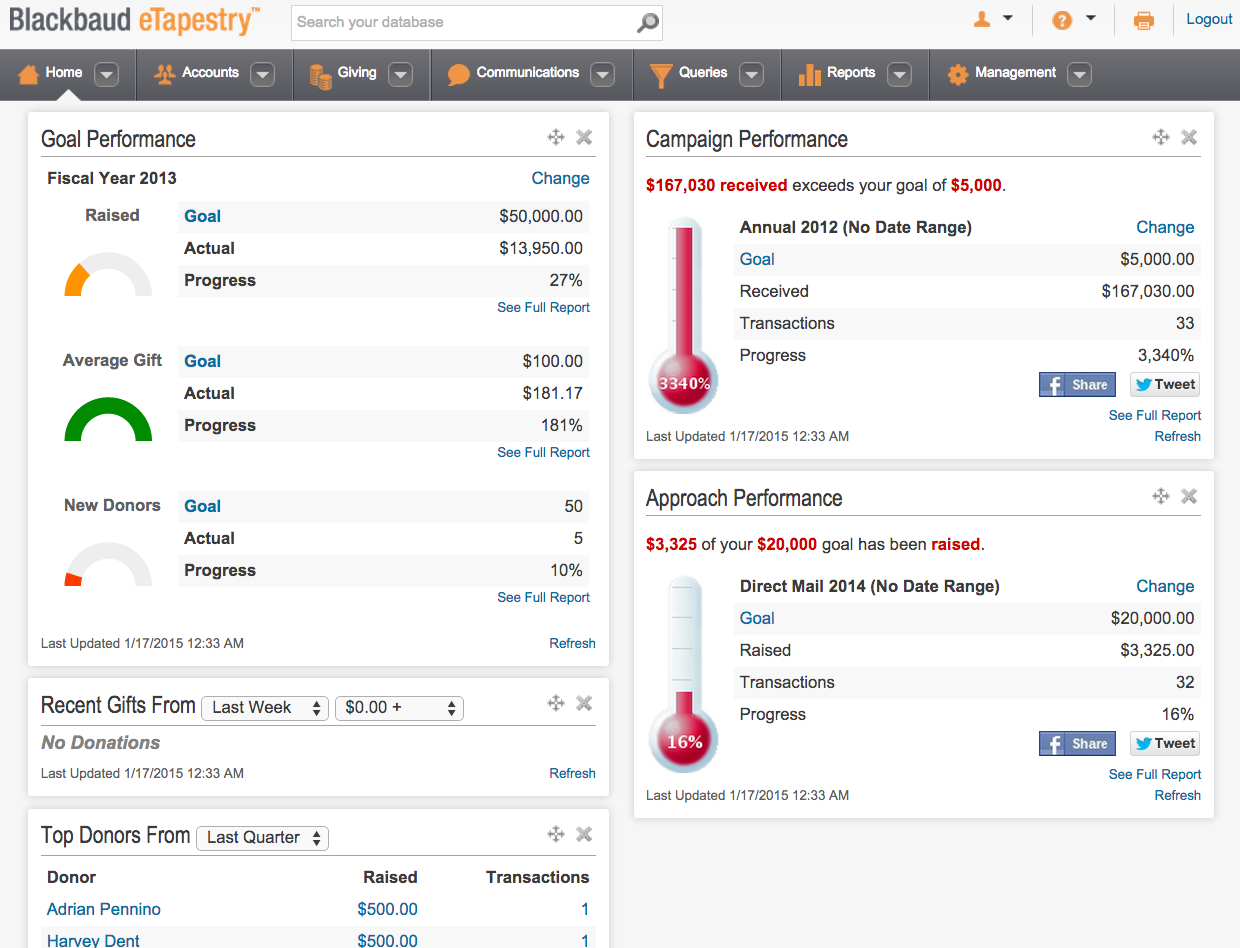
After setting up your organization’s fundraising benchmarks and arranging your tiles, your eTapestry dashboard should “pop” off the screen. Each time you login to your eTapestry database, your system will display performance data that is actionable and relevant to your fundraising plan and strategy.
This is what an eTapestry home dashboard looks like when it is fully setup.

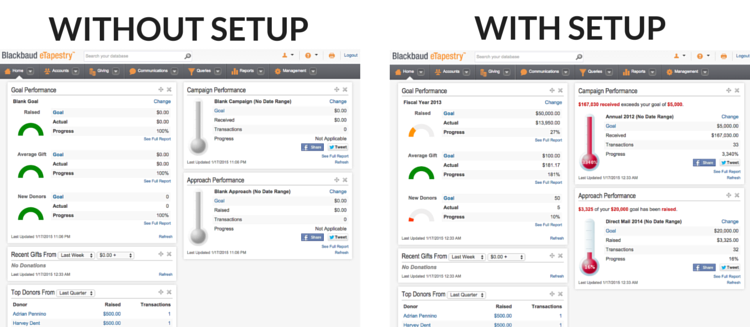
When viewed side-by-side, you can see the differences between a fully setup dashboard and an inactive dashboard.

As you can see, with a fully setup eTapestry database the dashboard pops off the screen with color, metrics, insight, and analytics. Each time you login to your eTapestry system you get a quick-view of performance based on a variety of indicators. With proper setup, the eTapestry home dashboard offers a break from custom queries and reports while also offering actionable information to improve fundraising performance.
Free Download
The Essential Kit to eTapestry Best Practices
- 4x PDF Guides
- 1x Template/Worksheet
- 1x 60-minute Webinar
- Here we can add a benefit, or we can delete one.
Join the 700+ users that already got their kit!
DOWNLOAD NOW