5 Ways to Use Apricot Reports
Apricot reports are packed with features that can extend the capability of your Social Solutions Apricot™ database. In fact, proper use of Apricot reports can transform your Apricot database into a powerful productivity application and business intelligence platform.
Let’s take a look a five unique ways to use Apricot reports.
1. Export
All data in Apricot can be exported to Excel through reports. Simply drag and drop columns into a report, add a few filters, publish the report, and then export the data to Excel.
Use exports to analyze data in an external reporting system like Excel or to simplify data transfers to another database.
Export to Excel
Although most reports and analytics can be designed and developed in Apricot without exporting the data to Excel, exporting data from Apricot provides additional flexibility to analyze, deconstruct, and present your data.
There are a few Excel functions that come in handy with Apricot exports:
- Lookups
- Pivot tables
- Formulas
- Charts
Export to another data system
A properly formatted export file from Apricot can simplify data entry between two or more systems, especially if Apricot is one of a portfolio of database systems you use to collaborate with external stakeholders or comply with their requirements (like a funder request for data).
To minimize time spent manipulating data after export from Apricot:
- Set up a template report in Apricot specifically for each export type
- Order the columns in the report exactly as required for the import in the other system
- Convert or transform data in Apricot prior to export (like changing “Yes” to “1” and “No” to “0”, or similar conversions)
- Include Record IDs from Apricot for all forms included in the export just in case you need to reference the data in Apricot later
2. Template
To simplify recurring reporting tasks, build report templates that you can use over and over again.
What are the top five reports you need to run each month?
If you can identify these reports, you only need to build the report once in Apricot. All Apricot reports are dynamic, updating with new data each time you run them. This means you can build a report template one time and run it over and over again at each reporting interval.
Use the following three reporting features to enhance report templates in Apricot software.
-
1. Dynamic filters
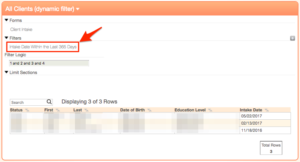
Dynamic filters update each time you run a report. For example, instead of a hard date range, use a rolling date range. The screenshot below shows a dynamic filter of “within the last 365 days.”
-
2. Global values
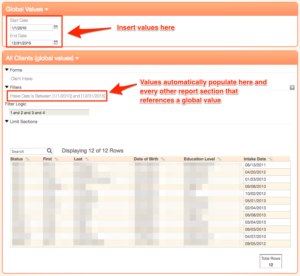
Global values populate variables in filters throughout your report. For example, instead of setting a date range in every section of a report, populate the start date and end date of your date range as global values and apply those variables to all sections of your report.
-
3. Run-time filters
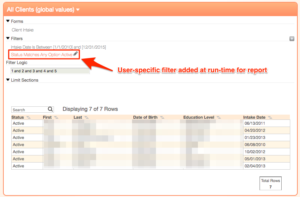
Users add run-time filters at the time the report is run. Run-time filters do not affect the structure of a report template, but allow individual users to narrow the criteria of a report for their specific purposes.
Here are a few tips for designing standard reports as templates in Apricot:
- Design and build only a handful of standard report templates. While there are no limits to the number of reports you can design and build in Apricot, we recommend sticking to a few standard report templates that are your highest priority.
- Apricot report lists can grow quickly. A long list of reports is hard to navigate and it is difficult to find what you want. We recommend keeping standard report templates in a single report category (or a few consolidated categories) so you know where to go to run them at each reporting interval.
- A newly published report isn’t accessible to users right away. You need to modify the permission set for a group of users in order for those users to see the new report. Assign report templates so they are accessible to your users.
3. Summary or printout
Apricot reports arrange and present data differently than forms. Although you can look through form data to find information on a client, volunteer, or service provider, that data may not be organized in a way that is helpful. Build a report template to display this data in a single view.
A “Client Summary” is a great example of this. Case managers often want to refresh their memory about a client before a new interaction, status check, or intervention.
- What services has this client received to date?
- Have any referrals been made to other agencies?
- What are the client’s goals and what is their progress toward those goals?
- Have other case managers been involved with this client?
- What was the outcome of the last five contacts made with the client?
Diving through a client’s document folder to answer these questions is tedious and time consuming. A multi-section report where each section of the report answers one of these questions is a perfect solution.
-
1. One section per summary
Separate the report into sections, one section per summary area. For example, one section with all services received or referrals made, another section for demographics and contact information, another section for assessment progress, and another section for goal progress.
-
2. Global value for client name or ID
Use a filter in each section of the report for either the client’s name or the client’s ID. Use a global value to populate this filter in each section of the report. A client-specific filter will narrow the report to a single client.
-
3. Vertical layout (where applicable)
Change the display style of a report section to vertical. This rotates the report from the default horizontal display. Vertical layouts are best for reading demographic data, contact information, and other static data.
4. Dashboard
Every Apricot database has the capability to create dashboards on the Apricot home screen. Unfortunately, we often find Apricot databases where the Apricot home screen is blank (there are no dashboards).
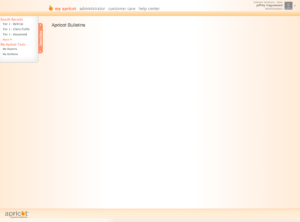
Dashboards present data visually and make data actionable. Dashboards are as flexible and customizable as Apricot reports because Apricot dashboards are Apricot reports set to display in a bulletin. Display anything you can imagine in reports on the Apricot home screen as a dashboard. When done right, a dashboard can look like this.
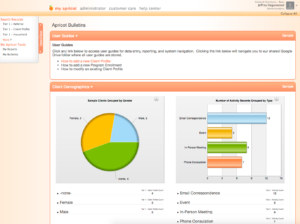
There are a few things you can do to make effective dashboards:
- Don’t overpopulate the home screen
- Collapse bulletins that aren’t used frequently and expand bulletins that are used frequently
- Set reports on the home screen as graph only or remove the row count
5. System navigation (shortcuts)
Did you know that reports could save you clicks and time navigating your Apricot database? This is a little known trick and is one of our favorite ways to use Apricot reports.
You can use a report to streamline system navigation and complete the following tasks (yes, each of these tasks can be completed directly from a report):
- Create a new case note or activity for a client in your active caseload (see screenshot)
- Navigate to the document folder of a client in your active caseload
- Create a new service record linked to an existing program enrollment
- Edit an existing record in a client’s document folder
- Add a new assessment for clients where the next required assessment is overdue
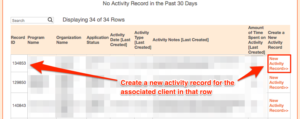
You will need custom report expressions enabled in order to implement reports with system navigation. At the time of this post, custom report expressions are a premium Apricot feature that requires activation by Social Solutions.
Ad hoc versus standard Apricot reports
All of the solutions presented in this post are what we call standard reports. Each is a template designed and built for a specific purpose. The majority of your reporting requirements are likely the same, week in and week out, month in and month out, quarter in and quarter out. Although your reports may shift slightly with changing requirements over time, most reports can be developed once.
If you feel like you are constantly developing new reports and fielding report requests non-stop, take a second look at your reporting strategy. Would it make more sense to devote time and resources toward developing a set of standard reports for your organization? Would you see a long-term benefit from having a batch of common reports?
Designing reports, whether in Apricot or other systems, can be as complex as you need it to be and as complex as you make it. Simplify Apricot reporting by making a clear distinction between ad hoc and standard Apricot reports. Build capacity in Apricot software by checking standard reports off your list.
Free Download
The Essential Kit to Apricot Best Practices
- 3x PDF Guides
- 2x Template/Worksheet
- 1x 60-minute Webinar
- ( checklist + slides )
Join the 250+ users that already got their kit!
DOWNLOAD NOW